
As of July 1, 2020, this post will be obsolete. See the corresponding post from my 2020 version of No Nonsense Extra Class License Study Guide.
A lot of questions have changed in this section. They’ve taken out all of the questions requiring you to calculate impedances and phase angles, although they have added questions about what these values mean. Overall, there was a net loss of six questions in this section…Dan
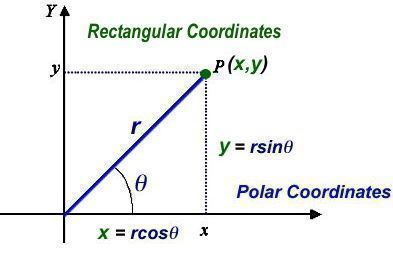
Most often when we plot values on a graph, we use the rectangular, or Cartesian, coordinate system. The two numbers that are used to define a point on a graph using rectangular coordinates are the coordinate values along the horizontal and vertical axes. (E5C11) In the graph above, point P is at x,y.
Rectangular coordinates is the coordinate system often used to display the resistive, inductive, and/or capacitive reactance components of an impedance. (E5C13) In rectangular notation, –jX represents a capacitive reactance. (E5C01) The impedance 50–j25 represents 50 ohms resistance in series with 25 ohms capacitive reactance. (E5C06)
When using rectangular coordinates to graph the impedance of a circuit, the horizontal axis represents the resistive component. (E5C09) When using rectangular coordinates to graph the impedance of a circuit, the vertical axis represents the reactive component. (E5C10)
To figure out the impedance of a circuit, you first plot the inductive reactance on the positive y-axis and the capacitive reactance on the negative y-axis. The net reactance, X, will be the sum of the two reactances. After you’ve computed the net reactance, you plot the resistance on the x-axis and compute the magnitude of the impedance, shown by r in the graph above. If you consider that r is the third side of a right triangle made up of the sides r, x, and y, r is equal to the square root of x2 and y2.
If you plot the impedance of a circuit using the rectangular coordinate system and find the impedance point falls on the right side of the graph on the horizontal axis, you know that the circuit impedance is equivalent to a pure resistance. (E5C12)
When thinking about how capacitive reactances, inductive reactances, and resistance combine, it’s useful to think in terms of polar coordinates. Polar coordinates is the coordinate system often used to display the phase angle of a circuit containing resistance, inductive and/or capacitive reactance. (E5C08) In a polar-coordinate system, each point on the graph has two values, a magnitude (shown by r in the figure above) and an angle (shown by θ in the figure above).
In polar coordinates, impedances are described by phase angle and amplitude. (E5C02) These kinds of quantities are sometimes called vectors. A vector is a quantity with both magnitude and an angular component. (E5C07)
In polar coordinates, a positive phase angle represents an inductive reactance. (E5C03) In polar coordinates, a negative phase angle represents a capacitive reactance. (E5C04) Phasor diagram is the name of the diagram used to show the phase relationship between impedances and resistances at a given frequency. (E5C05)
Now, let’s take a look at some actual circuits.
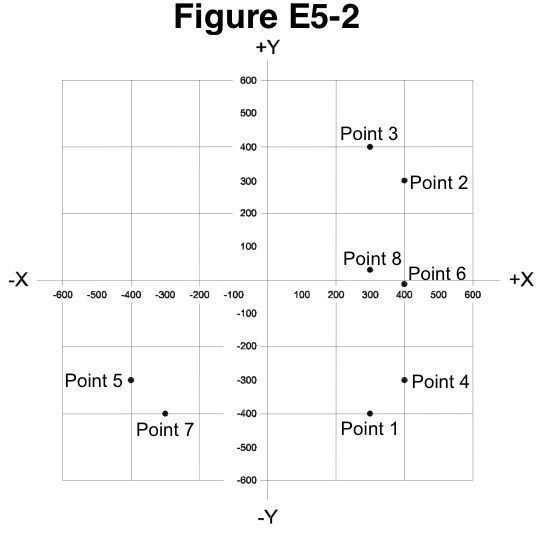
On Figure E5-2, the point that best represents the impedance of a series circuit consisting of a 400 ohm resistor and a 38 picofarad capacitor at 14 MHz is Point 4. (E5C14) Right off the bat, we know that the only choices are really Points 2, 4, and 6 because the resistance is 400 ohms. Next, we calculate the capacitive reactance:
XC = 1/2πfC = 1/(2 × 3.14 × 14×106 × 38×10-12) ≈ 300 ohms
Because the reactance is capacitive, it’s plotted as a negative value.
On Figure E5-2, the point that best represents the impedance of a series circuit consisting of a 300 ohm resistor and an 18 microhenry inductor at 3.505 MHz is Point 3. (E5C15) The resistance is 300 ohms and the reactance is:
XL = 2πfL = 2 × 3.14 × 3.505×106 × 18×10-6) ≈ 400 ohms
And, since the reactance is inductive, it’s plotted as a postive value.
On Figure E5-2, the point that best represents the impedance of a series circuit consisting of a 300 ohm resistor and a 19 picofarad capacitor at 21.200 MHz is Point 1. (E5C16) The resistance is 300 ohms, and the reactance is:
XC = 1/2πfC = 1/(2 × 3.14 × 21.2×106 × 19×10-12) ≈ 400 ohms
Because the reactance is capacitive, it’s plotted as a negative value.
On Figure E5-2, the point that best represents the impedance of a series circuit consisting of a 300-ohm resistor, a 0.64-microhenry inductor and an 85-picofarad capacitor at 29.400 MHz is Point 8. (E5C17) This problem is a little tougher because it has both capacitive and inductive reactance.
XC = 1/2πfC = 1/(2 × 3.14 × 29.4×106 × 85×10-12) ≈ 63.7 ohms
XL = 2πfL = 2 × 3.14 × 29.4×106 × 0.64×10-6) ≈ 118.2 ohms
X = XL – XC = 118.2 – 63.7 = 54.5 ohms
Because the net reactance is inductive, it is plotted as a positive value, and because the resistance is 300 ohms, the answer is Point 8.
E5C17 Should have been written with 24.9 MHz instead of 29.4 MHz per https://hamstudy.org/browse/E4_2016/E5C