
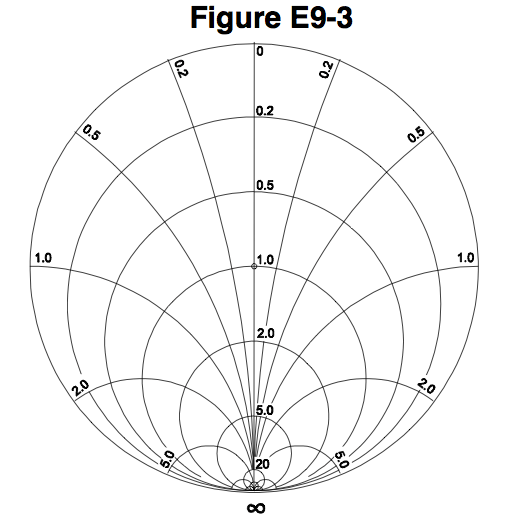
A Smith chart, shown in Figure E9-3 above, is a chart designed to solve transmission line problems graphically. While a complete discussion of the theory behind the Smith Chart is outside the scope of this study guide, a good discussion of the Smith Chart can be found on the ARRL website.
The Smith chart coordinate system is comprised of resistance circles and reactance arcs. The resistance axis is the only straight line on the Smith chart. Points on this axis are pure resistances. In practice, you want to position the chart so that 0 ohms is at the far left, while infinity is at the far right.
QUESTION: What type of coordinate system is used in a Smith chart? (E9G02)
ANSWER: Resistance circles and reactance arcs
QUESTION: What are the two families of circles and arcs that make up a Smith chart? (E9G04)
ANSWER: Resistance and reactance
QUESTION: On the Smith chart shown in Figure E9-3, what is the only straight line shown? (E9G07)
ANSWER: The resistance axis
The arcs on a Smith chart represent points with constant reactance, and the large outer circle on which the reactance arcs terminate is called the reactance axis. Points on the reactance axis have a resistance of 0 ohms. When oriented so that the resistance axis is horizontal, positive reactances are plotted above the resistance axis and negative reactances below.
QUESTION: What do the arcs on a Smith chart represent? (E9G10)
ANSWER: Points with constant reactance
QUESTION: On the Smith chart shown in Figure E9-3, what is the name for the large outer circle on which the reactance arcs terminate? (E9G06)
ANSWER: Reactance axis
When you work with a Smith Chart, you use resistance and reactance values that are normalized to the characteristic impedance of the system. What this means is that if you’re working with a 50 ohm transmission line, you’d normally divide the impedances by 50, meaning that a 50 ohm resistance would then be plotted on the resistance axis at the point marked 1.0. A reactance of 50 + j100 would be plotted on the resistance circle going through the prime center where it intersects the reactance arc marked 2.0. The point marked 1.0 on the resistance axis is called the prime center of the Smith Chart, so we say that the process of normalization with regard to a Smith chart refers to reassigning impedance values with regard to the prime center.
QUESTION: What is the process of normalization with regard to a Smith chart? (E9G08)
ANSWER: Reassigning impedance values with regard to the prime center
Smith Charts are often used for calculating impedance and SWR along a transmission line. When used to calculate SWR, standing-wave ratio circles are often added to the Smith Chart.
QUESTION: Which of the following can be calculated using a Smith chart? (E9G01)
ANSWER: Impedance along transmission lines
QUESTION: Which of the following is often determined using a Smith chart? (E9G03)
ANSWER: Impedance and SWR values in transmission lines
QUESTION: What third family of circles is often added to a Smith chart during the process of solving problems? (E9G09)
ANSWER: Standing wave ratio circles
Another common application for the Smith Chart is to determine the length and position of an impedance matching stub. When using the Smith Chart for this application, remember that the wavelength scales on a Smith chart are calibrated in fractions of transmission line electrical wavelength. When cutting a length of feedline for an impedance matching stub, remember to use the velocity factor of the feedline to find the actual physical length.
QUESTION: Which of the following is a common use for a Smith chart? (E9G05)
ANSWER: Determine the length and position of an impedance matching stub
QUESTION: How are the wavelength scales on a Smith chart calibrated? (E9G11)
ANSWER: In fractions of transmission line electrical wavelength
Leave a Reply