• Skip to primary navigation
  • Skip to main content
  • Skip to primary sidebar
  • Skip to footer

KB6NU's Ham Radio Blog

KB6NU's Ham Radio Blog
  • HOME
  • Study Guides
  • Teach a One-Day Tech Class
  • W8SRC Repeater Guide
  • Advertise
  • Hire Me

Smith Chart

Videos from Mastodon

September 14, 2026 By Dan KB6NU Leave a Comment

The other day, while reading Mastodon—which is kind of like Twitter for nerds—I came across a couple of videos worthy of sharing here.

The scariest chart in electrical engineering

Veritasium applies his tech explaining skills to one of the most misunderstood, but useful, design aids in amateur radio.

Whole Milk: Deep Machine Learning CW decoding demo on Windows

This is a demo of a new CW decoding application offering real-time full-band decoding of CW using deep-learning models and GPU- and NPU-accelerated waterfall and ML inference. The developer claims that, with a modern computer, it can decode all contest bands in parallel, and that there is no artificial limit on number of attached receivers.

And, since I always post three videos at a time, here’s a third that’s been lingering in a tab on my browser for a couple of weeks now.

The giant Collins HF discone antenna at the Titan Missile Museum

This is really an incredible antenna, and you really can drive right up to it and hook your rig to it. I like that KB9RLW explains how discones work in addition to talking about the giant discone antenna.
Filed Under: Antennas, CW, Electronics Theory Tagged With: Collins discone antenna, Smith Chart

2020 Extra Class study guide: E9G -The Smith Chart

March 13, 2020 By Dan KB6NU 2 Comments

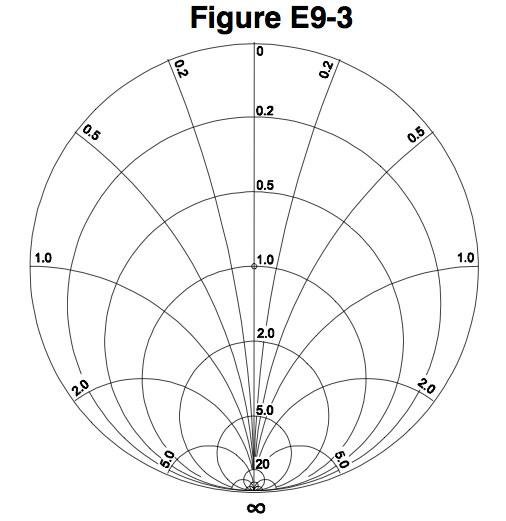
A Smith chart, shown in Figure E9-3 above, is a chart designed to solve transmission line problems graphically. While a complete discussion of the theory behind the Smith Chart is outside the scope of this study guide, a good discussion of the Smith Chart can be found on the ARRL website.

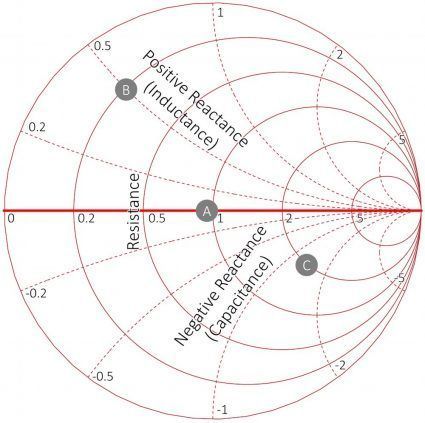
The Smith chart coordinate system is comprised of resistance circles and reactance arcs. The resistance axis is the only straight line on the Smith chart. Points on this axis are pure resistances. In practice, you want to position the chart so that 0 ohms is at the far left, while infinity is at the far right.

QUESTION: What type of coordinate system is used in a Smith chart? (E9G02)
ANSWER: Resistance circles and reactance arcs

QUESTION: What are the two families of circles and arcs that make up a Smith chart? (E9G04)
ANSWER: Resistance and reactance

QUESTION: On the Smith chart shown in Figure E9-3, what is the only straight line shown? (E9G07)
ANSWER: The resistance axis

The arcs on a Smith chart represent points with constant reactance, and the large outer circle on which the reactance arcs terminate is called the reactance axis. Points on the reactance axis have a resistance of 0 ohms. When oriented so that the resistance axis is horizontal, positive reactances are plotted above the resistance axis and negative reactances below.

QUESTION: What do the arcs on a Smith chart represent? (E9G10)
ANSWER: Points with constant reactance

QUESTION: On the Smith chart shown in Figure E9-3, what is the name for the large outer circle on which the reactance arcs terminate? (E9G06)
ANSWER: Reactance axis

When you work with a Smith Chart, you use resistance and reactance values that are normalized to the characteristic impedance of the system. What this means is that if you’re working with a 50 ohm transmission line, you’d normally divide the impedances by 50, meaning that a 50 ohm resistance would then be plotted on the resistance axis at the point marked 1.0. A reactance of 50 + j100 would be plotted on the resistance circle going through the prime center where it intersects the reactance arc marked 2.0. The point marked 1.0 on the resistance axis is called the prime center of the Smith Chart, so we say that the process of normalization with regard to a Smith chart refers to reassigning impedance values with regard to the prime center.

QUESTION: What is the process of normalization with regard to a Smith chart? (E9G08)
ANSWER: Reassigning impedance values with regard to the prime center

Smith Charts are often used for calculating impedance and SWR along a transmission line. When used to calculate SWR, standing-wave ratio circles are often added to the Smith Chart.

QUESTION: Which of the following can be calculated using a Smith chart? (E9G01)
ANSWER: Impedance along transmission lines

QUESTION: Which of the following is often determined using a Smith chart? (E9G03)
ANSWER: Impedance and SWR values in transmission lines

QUESTION: What third family of circles is often added to a Smith chart during the process of solving problems? (E9G09)
ANSWER: Standing wave ratio circles

Another common application for the Smith Chart is to determine the length and position of an impedance matching stub. When using the Smith Chart for this application, remember that the wavelength scales on a Smith chart are calibrated in fractions of transmission line electrical wavelength. When cutting a length of feedline for an impedance matching stub, remember to use the velocity factor of the feedline to find the actual physical length.

QUESTION: Which of the following is a common use for a Smith chart? (E9G05)
ANSWER: Determine the length and position of an impedance matching stub

QUESTION: How are the wavelength scales on a Smith chart calibrated? (E9G11)
ANSWER: In fractions of transmission line electrical wavelength

Filed Under: 2020 Extra Class Study Guide Tagged With: Smith Chart

One of these days I’m really going to learn how to use a Smith Chart

April 14, 2019 By Dan KB6NU 3 Comments

I keep saying that one day I’m going to really master the Smith Chart. I kind of understand them, but don’t ask me to give an impromptu lecture on how they work and what they’re used for. That being the case, I keep collecting links to articles on the net that are supposed to explain how they work. Here’s my latest collection:

How does a Smith Chart work?
The Smith chart appeared in 1939 as a graph-based method of simplifying the complex math (that is, calculations involving variables of the form x + jy) needed to describe the characteristics of microwave components. Although calculators and computers can now make short work of the problems the Smith chart was designed to solve, the Smith chart, like other graphical calculation aids remains a valuable tool.

The Smith chart: more vital after all these years
Using the Smith chart, you can graphically illustrate the complex impedance, Z=R+jX, of a transmission line, antenna, amplifier, or any signal point in the RF range at which the simple resistive approximation is not sufficiently valid. However, the ability to place the real and imaginary parts of Z on a 2-D graph instead of using numbers for R and X is not what makes the Smith chart significant.

Smith Chart: Old tool, new home
Even in these days, when news travels instantly and there are few secrets, it’s possible to miss an important or interesting story. That’s what happened to me recently: I was doing some online research and came across an item from October 2015, published at IEEE Microwave Magazine : “The Smith Chart Comes Home [President’s Column].”

The news was simple: the column explained that IEEE MTT-S [Microwave Theory and Techniques Society] was buying “the rights from the Smith family of the Smith trademark belonging to Analog Instruments, along with the copyright. In return, the MTT-S would make the Smith chart available to students, practitioners, and indeed people all over the world involved in microwave technology.”


Filed Under: Antennas Tagged With: Smith Chart

From my Twitter feed: WSPR antenna testing, 3D Smith Chart, SW activity monitor

July 10, 2017 By Dan KB6NU 1 Comment

OH8STN's avatar

@OH8STN

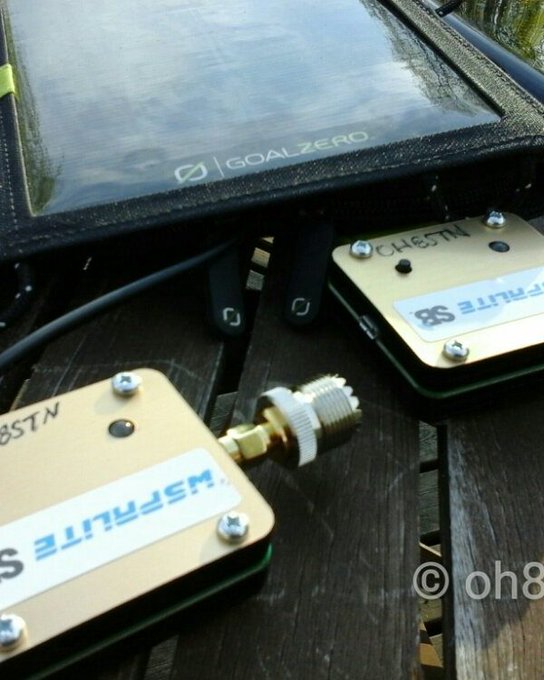
WSPR Antenna Testing Methodology oh8stn.org/blog/2017/06/2…

Media preview

MicrowavesRF's avatar

@MicrowavesRF

The Smith Chart Enters a New Dimension bit.ly/2uRUqng

Media preview


hackaday's avatar

@hackaday
 Radio project on #Hackadayio detects activity on shortwave channels using #RaspberryPi. bit.ly/22zgob5
Media preview

Filed Under: Antennas, Digital Modes, Gear/Gadgets, Microcontrollers, Software-Defined Radio, SWLing Tagged With: Smith Chart, SWL, WSPR

2016 Extra Class Study Guide: E9G – The Smith Chart

March 5, 2016 By Dan KB6NU 2 Comments

On July 1, 2020, the Extra Class question pool is being updated, making this post obsolete. See the corresponding post from my 2020 version of No Nonsense Extra Class License Study Guide.


Figure E9-3

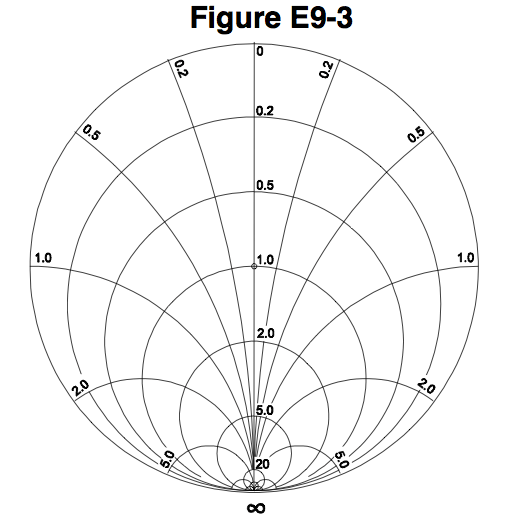
A Smith chart is shown in Figure E9-3 above. (E9G05) It is a chart designed to solve transmission line problems graphically. While a complete discussion of the theory behind the Smith Chart is outside the scope of this study guide, a good discussion of the Smith Chart can be found on the ARRL website (http://www.arrl.org/files/file/Antenna%20Book%20Supplemental%20Files/22nd%20Edition/Smith%20Chart%20Supplement%20-%20Corrected%20Jan%202012.pdf).

The coordinate system is used in a Smith chart is comprised of resistance circles and reactance arcs. (E9G02) Resistance and reactance are the two families of circles and arcs that make up a Smith chart. (E9G04)

The resistance axis is the only straight line shown on the Smith chart shown in Figure E9-3. (E9G07) Points on this axis are pure resistances. In practice, you want to position the chart so that 0 ohms is at the far left, while infinity is at the far right.

The arcs on a Smith chart represent points with constant reactance. (E9G10) On the Smith chart, shown in Figure E9-3, the name for the large outer circle on which the reactance arcs terminate is the reactance axis. (E9G06) Points on the reactance axis have a resistance of 0 ohms. When oriented so that the resistance axis is horizontal, positive reactances are plotted above the resistance axis and negative reactances below.

The process of normalization with regard to a Smith chart refers to reassigning impedance values with regard to the prime center. (E9G08) The prime center is the point marked 1.0 on the resistance axis. If you’re working with a 50 ohm transmission line, you’d normally divide the impedances by 50, meaning that a 50 ohm resistance would then be plotted on the resistance axis at the point marked 1.0. A reactance of 50 + j100 would be plotted on the resistance circle going through the prime center where it intersects the reactance arc marked 2.0.

Impedance along transmission lines can be calculated using a Smith chart. (E9G01) Impedance and SWR values in transmission lines are often determined using a Smith chart. (E9G03) Standing-wave ratio circles are often added to a Smith chart during the process of solving problems. (E9G09)

The wavelength scales on a Smith chart are calibrated in fractions of transmission line electrical wavelength. (E9G11) These are useful when trying to determine how long transmission lines must be when used to match a load to a transmitter.

Filed Under: Antennas, Books and Magazines, Classes/Testing/Licensing Tagged With: Smith Chart

Primary Sidebar

No Nonsense Technician Class License Study Guide (for tests given between July 2026 and June 2030)

New No Nonsense Technican Class Study Guide now available!

The 2026 version of my Tech Class study guide is now available, and as always, the PDF version is FREE!. The ePub version costs $11.97, and a Kindle version and paperback version will be available on Amazon shortly.

Click here to get all of my "No Nonsense" study guides.

Also available: The CW Geek's Guide to Having Fun with Morse Code

W5SWL.Com
Retevis Ailunce H1 DMR Radio
DXpander: Cobweb antennas, Laser Cutting

You’ve got mail!

Enter your email address below and get an email every time I publish a new post.

Email


I frequently teach classes to help newcomers get their licenses. The next class will take place on Saturday, October 10, 2026 on the University of Michigan campus. Click here for more information.

If you can't make the class, subscribe to the mailing list to be notified of when the next class will be held.

You can always download my free study guide, and if you have any questions about the classes, or amateur radio in general, please feel free to email me directly.

Support KB6NU.Com

Donate $7.30 and get two of these cool stickers. Measuring 4.25-in. W by 2.75-in. H, it's perfect for your car, your shack, or wherever!

Contact me

If you have a question or comment about one of my blog posts, or a question about any of the material in my study guides, or just a question about ham radio in general, you can email me at [email protected].

Blogs You Should Also Read

  • AE5X: A CW-centric blog from Kingswood, Texas
  • K0LWC Blog
  • LA3ZA Ham Radio Blog
  • Little Radios, Big Fun – WB3GCK
  • Mr. Vacuum Tube's Blog
  • Radio Artisan – K3NG
  • The K0NR Weblog
  • VE3WDM's QRP Ham Radio Blog
  • W2LJ’s Blog

Ham Radio Websites

  • Dashtoons – The Hammin' Comedy by Jeff K1NSS

Podcasts

  • ICQ Podcast
  • Linux in the Ham Schack
  • No Nonsense Amateur Radio Podcast
  • Resonant Frequency Amateur Radio Podcast

Recent Comments

  • Bulin 47 AI on ICQPodcast Episode 485 – World Cup Special Event Station
  • Jesse Alexander on What do you think of this artwork for the ham radio EMF Explorer
  • CADProps on My first go at 3D printing not quite a success
  • Dan KB6NU on A Media Guide to Amateur Radio
  • Steve Stroh N8GNJ on A Media Guide to Amateur Radio

Meta

  • Log in
  • Entries feed
  • Comments feed
  • WordPress.org

Footer

Copyright © 2026 Daniel M. Romanchik, KB6NU · Log in