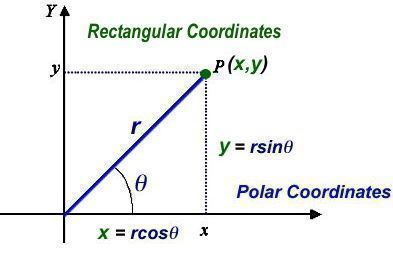
Most often when we plot values on a graph, we use the rectangular, or Cartesian, coordinate system. The two numbers that are used to define a point on a graph using rectangular coordinates are the coordinate values along the horizontal and vertical axes. In the graph above, point P is at x,y.
Rectangular coordinates is the coordinate system often used to display the resistive, inductive, and/or capacitive reactance components of an impedance. When using rectangular coordinates to graph the impedance of a circuit, the X axis, or horizontal axis, represents the resistive component, and the Y axis, or vertical axis, represents the reactive component.
QUESTION: What coordinate system is often used to display the resistive, inductive, and/or capacitive reactance components of impedance? (E5C04)
ANSWER: Rectangular coordinates
QUESTION: When using rectangular coordinates to graph the impedance of a circuit, what do the axes represent? (E5C09)
ANSWER: The X axis represents the resistive component and the Y axis represents the reactive component
QUESTION: Where is the impedance of a pure resistance plotted on rectangular coordinates? (E5C07)
ANSWER: On the horizontal axis
In rectangular notation, we’d represent an impedance as R +/- jX, where X is the value of the reactance. When X is inductive reactance, the reactance is a positive value. When X is negative, the reactance is capacitive.
QUESTION: Which of the following represents capacitive reactance in rectangular notation? (E5C01)
ANSWER: -jX
QUESTION: What does the impedance 50-j25 represent? (E5C06)
ANSWER: 50 ohms resistance in series with 25 ohms capacitive reactance
If the impedance was 50 + j25, then the circuit would have 50 ohms resistance in series with 25 ohm of inductive reactance because +jX represents an inductive reactance.
To figure out the impedance of a circuit, you first plot the inductive reactance on the positive y-axis and the capacitive reactance on the negative y-axis. The net reactance, X, will be the sum of the two reactances. After you’ve computed the net reactance, you plot the resistance on the x-axis and compute the magnitude of the impedance, shown by r in the graph above. If you consider that r is the third side of a right triangle made up of the sides r, x, and y, r is equal to the square root of x2 + y2.
When thinking about how capacitive reactances, inductive reactances, and resistances combine in a circuit containing resistors, capacitors, and inductors, it’s useful to think in terms of polar coordinates. Polar coordinates show you both the magnitude of an impedance (shown by r in the figure above) and the phase angle of an impedance (shown by θ in the figure above).
QUESTION: What coordinate system is often used to display the phase angle of a circuit containing resistance, inductive and/or capacitive reactance? (E5C08)
ANSWER: Polar coordinates
QUESTION: How are impedances described in polar coordinates? (E5C02)
ANSWER: By phase angle and magnitude
In polar coordinates, a positive phase angle represents an inductive reactance, and a a negative phase angle represents a capacitive reactance. Phasor diagram is the name of the diagram used to show the phase relationship between impedances and resistances at a given frequency.
QUESTION: Which of the following represents an inductive reactance in polar coordinates? (E5C03)
ANSWER: A positive phase angle
QUESTION: What is the name of the diagram used to show the phase relationship between impedances at a given frequency? (E5C05)
ANSWER: Phasor diagram
Now, let’s take a look at some actual circuits.
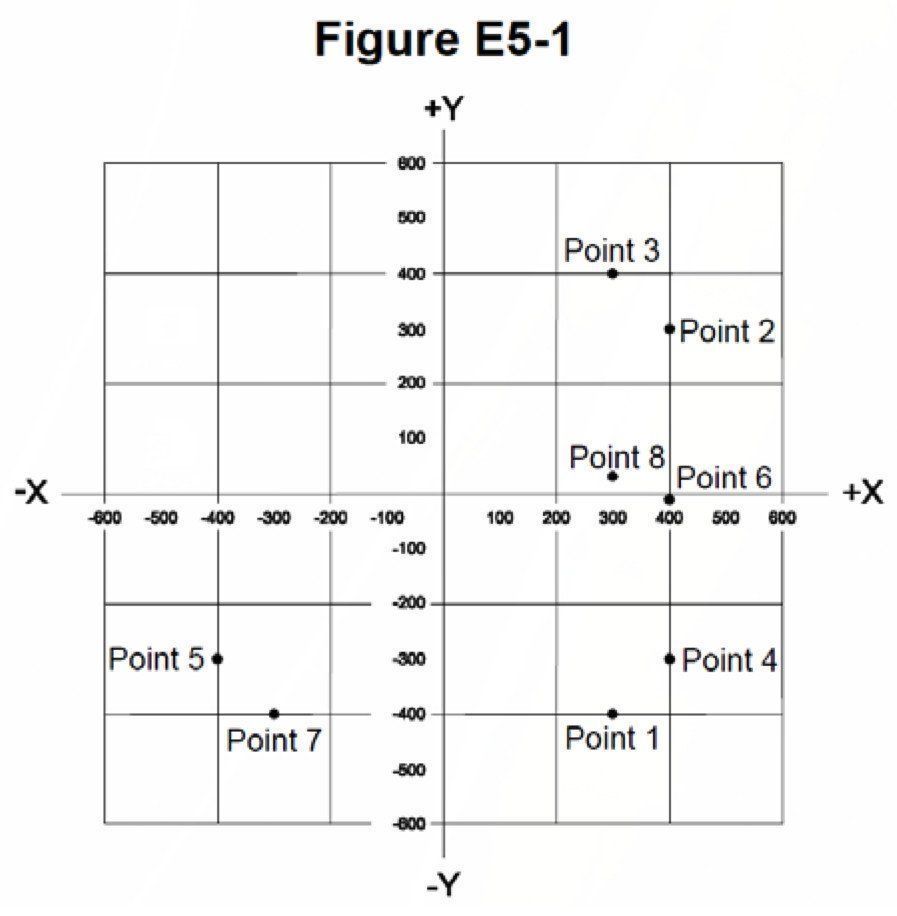
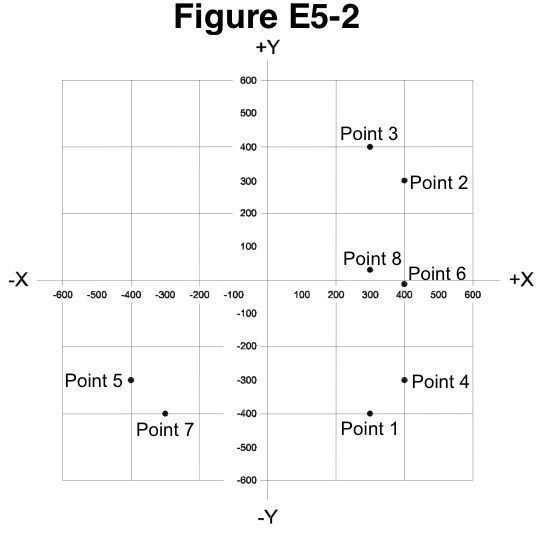
QUESTION: Which point on Figure E5-1 best represents the impedance of a series circuit consisting of a 400-ohm resistor and a 38-picofarad capacitor at 14 MHz? (E5C10)
ANSWER: Point 4
Here’s how to figure that out. Right off the bat, we know that the only choices are really Points 2, 4, and 6 because the resistance is 400 ohms. Next, we calculate the capacitive reactance: XC = 1/2πfC = 1/(2 × 3.14 × 14×106 × 38×10-12) ≈ 300 ohms. Because the reactance is capacitive, it’s as a negative value. Point 4 is the only point that has a resistance of 400 ohms a reactance of -300 ohms.
QUESTION: Which point in Figure E5-1 best represents the impedance of a series circuit consisting of a 300-ohm resistor and an 18-microhenry inductor at 3.505 MHz? (E5C11)
ANSWER: Point 3
The resistance for this question is specified to be 300 ohms and the reactance is: XL = 2πfL = 2 × 3.14 × 3.505×106 × 18×10-6) ≈ 400 ohms. Because the reactance is inductive, we know it is a positive value. Point 3 is the only point with a resistance of 300 ohms and a reactance of +400 ohms.
QUESTION: Which point on Figure E5-1 best represents the impedance of a series circuit consisting of a 300-ohm resistor and a 19-picofarad capacitor at 21.200 MHz? (E5C12)
ANSWER: Point 1
The resistance is 300 ohms, and the reactance is: XC = 1/2πfC = 1/(2 × 3.14 × 21.2×106 × 19×10-12) ≈ 400 ohms. Because the reactance is capacitive, it’s -400 ohms. Point 1 is the only point with a resistance of 300 ohms and a reactance of -400 ohms.