
Shortly after Field Day ended, Bill WC3B posted a map of the contacts he made on Twitter. “How cool,” I thought, and asked him how he’d done it. As it turns out, the map was a function of the N3FJP Field Day logging program.
It then occurred to me that there must be mapping programs on the web. I did a quick Google to find two websites that would allow me to generate a map of my own: LogView by EI8IC and Log2Map by ON6ZQ.
Log View
LogView is a free, post-contest log-visualisation tool. It plots the QSOs in a Cabrillo-format contest-log on to one of 8 different maps by finding the position of each QSO from an online database of about 1,100,000 W/VE callsigns. Here’s the map generated by Log View:
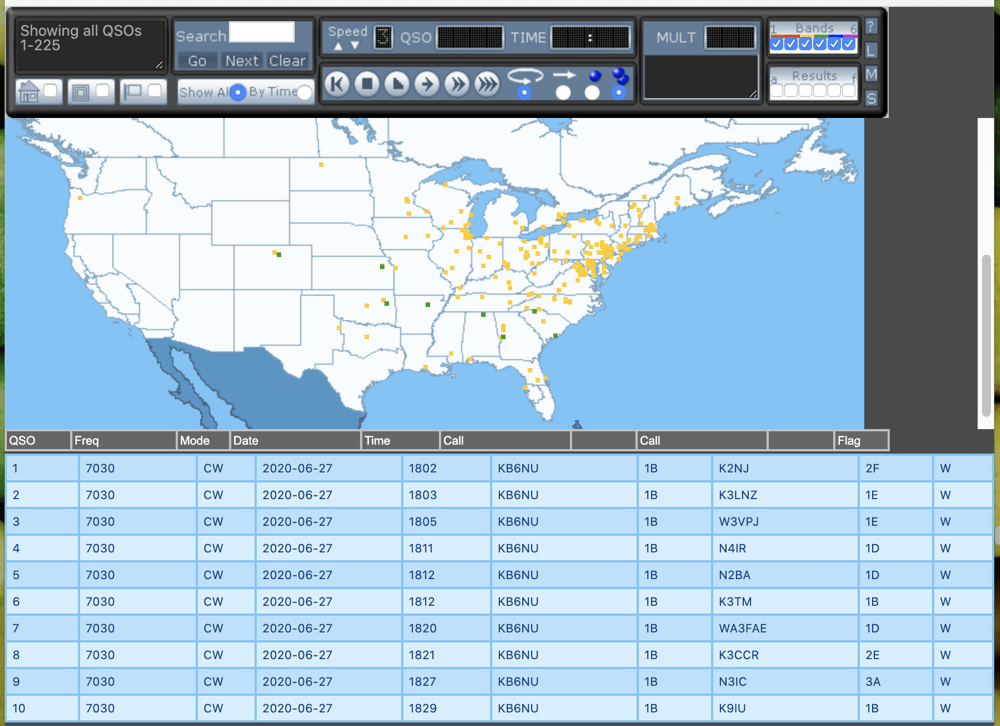
This tool can do more than just produce a map. It’s worth checking out if you want to analyze your contest logs.
Log2Map accepts both Cabrillo and ADIF files and generates a map like the one shown below:
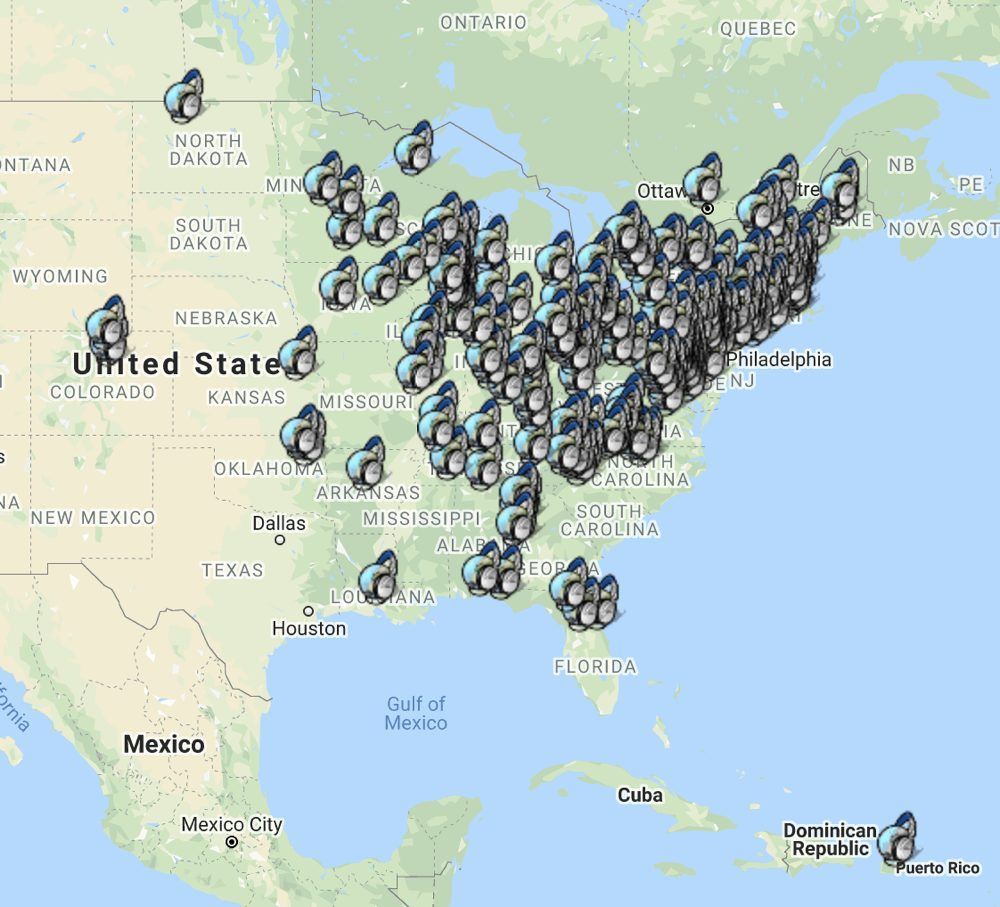
I kinda like this map better than the LogView map, but I wish that I could change the marker. I think the marker is a little bit big for this kind of map.
I found a couple of other mapping websites, but many of them wanted the log to contain the latitudes and longitudes. I didn’t know how to do that quickly, so I just moved on.
There must be others out there that I didn’t find. If you know of any others, please comment below.